As you move the mouse pointer over the image, the slice number, position within the slice, and pixel intensity are shown at the bottom of the Image Display frame. See dimension display.
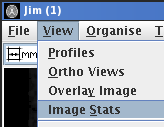
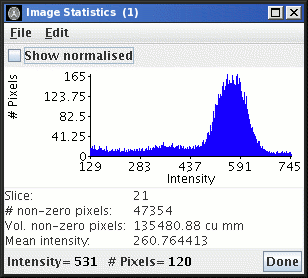
You can show statistics about the image in the Image Statistics
window. Click on Image Stats under the View menu:


 , then the number of pixels on the
y-axis is normalised so that the sum of all histogram
y-values is equal to 1.0.
As the mouse is moved over the histogram graph, the intensity and number of pixels at the mouse location are shown at the bottom of the Image Statistics frame.
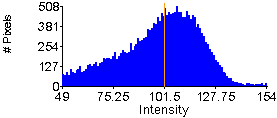
As the mouse is moved over the image, the intensity beneath the mouse is shown as an orange vertical line on the histogram.

For movies, the Image statistics for the visible slice is continuously updated as the movie steps through the frames.
Write under
the File menu in the
Image Statistics frame: 
The formal specification of an image statistics file is given in the file formats section. An example of the format of the image statics written to disk is shown below:
# Image stats written "06 Mar 2006 17:10:44" by Operator ID="xinapse"
# Image source= "/home/xinapse/images/A.PATIENT._001_STUDY_1_SERIES_6"
# Slice: 25
# Number of non-zero pixels: 17932
# Volume of non-zero pixels: 51302.45 cu mm
# Mean pixel intensity: 109.32
# Visible histogram:
0.0	4760.0
1.0	201.0
2.0	105.0
3.0	77.0
...
The data intensity histogram is written in a tab-separated table with two
columns: the first is the pixel intensity value,
and the second is the number of pixels with that intensity. For
normalised histograms, the sum of all the values in the second column is equal to 1.0.
Export as
      PDF
under
the File menu in the
Image Statistics frame: 
A File Chooser will now pop up for you to select a PDF file to write the histogram.
Click the  button when you have
finished with image statistics.