Statistics about the ROIs can be displayed in the ROI Toolkit. To turn
on and off the display of statistics, click the "Show Statistics"
check box: 
ROI editing is much slower when statistics are being shown, since each time an ROI is changed, the statistics have to be re-computed; you may therefore prefer to keep "Show Statistics" turned off while editing ROIs. This does not affect the final computation of ROI areas and volumes etc., since when needed, the statistics are always computed.
Unlike many other image analysis programmes, the calculation of ROI statistics in Jim is almost exact; it is common in medical image analysis to calculate statistics around whole pixels, even though ROIs do not necessarily encompass whole pixels.
Note: the computation of ROI area statistics for
Irregular ROIs is NOT "exact", but the
error is within known (small) bounds. Similarly, the computation
of ROI pixel intensity statistics is also not exact, but the
behaviour of the errors are stable and well-understood.
The algorithms used to calculate statistics are explained in the algorithms section.
The following are computed and shown in the ROI Toolkit window
when "Show Statistics" is turned on:
Computed Statistics
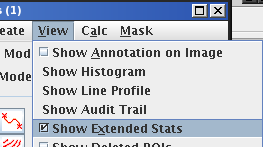
If the turn on "Extended Statistics" from the
View menu,  ,
the following additional statistics are computed and shown:
If the display units
are set to mm, the perimeter and Feret's diameters are shown in mm; if the
display units are set to
pixels, they are shown in pixels.
Note: If you select a deleted ROI, the statistics shown for the ROI are those that applied at the time the ROI was deleted.
In addition, when an ROI is selected, the user may choose to Annotate
an ROI with text. To do this, Whenever you re-select this ROI, the annotation will appear in the
annotation text box. In addition, you can show the annotation on the
image adjacent to the ROI by selecting
Note: When you type in annotation, white space characters (such
as "\" will be removed, since they cannot be written safely to the ROI
file.
ROI statistics can be written to a disk file in a tabular format
suitable for importing into a spread-sheet for further
analysis. The format of a statistics file is given in the file formats section, and is a space
(" ") separated tabular format, with each ROI contributing one
row to the table.
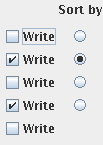
You choose which of the statistics using the check boxes to the right
of the statistics in the "ROI Details" panel:
You can also choose to sort the statistics into different
orders. By default they will simply be written out
slice-by-slice. However, if you select one of the buttons
beneath the "Sort by" column, you can sort the statistics into
different order.
Write the ROI statistics using A File Chooser will prompt you for
a file name into which to write the statistics (default
extension ".txt"; default file name from the image name). If the
stats file already exists, you will be asked whether
you want to:
The ROI Toolkit will now calculate the statistics for all the ROIs
in the image, and store those requested in the stats file.
Note: any space characters in the annotation text will be
replaced by an underscore ("_"), since the space character is used
to delimit the columns of the table.
During the write operation, you are prevented from
changing the ROIs in the loaded image. However, you may load a
new image and continue working with that if you wish.
 .
.
 .
ROI annotation is stored in ROI disk files as part of the ROI definition.
Writing Statistics
 . Each item checked will
appear as a separate column in the ROI stats file.

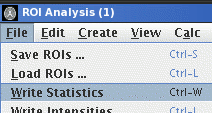
Write Statistics from the File
menu of the ROI Toolkit:
 ,
,