pH Estimation from CEST Data
One application of CEST Z-spectrum analysis is the estimation of pH
using pH-responsive probes. Such probes may:
- Have two labile proton frequencies, and the ratio of the saturation
efficiencies at the two frequencies is pH-dependent.
- Have a non-linear relationship between the saturation power and the saturation
efficiency at a single offset frequency. The ratio of the saturation
efficiency at the two RF powers is pH-dependent.
Using a calibration, the ratios above may be used to estimate pH in
vivo.
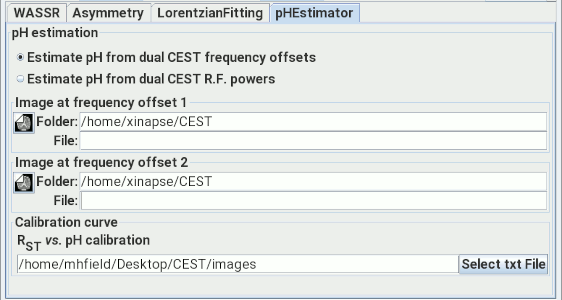
To perform this type of analysis, select the pH Estimator tab:

You can then select whether you want to:
 .
Select two input images of the CEST saturation efficiency at two different
frequency offsets.
 .
Select two input images of the CEST saturation efficiency at two
R.F. saturation powers.
These input images will have been produced either from
asymmetry analysis, or
Lorentzian fitting.
If both cases, you will need to provide a calibration curve, in the form of a
text file containing two columns of numerical data:
- For dual frequency offsets, the first column (x-axis) contains the pH
values and the second column (y-axis) contains the ratio of saturation efficiency at
the two frequencies (RST):
RST = SatEff2 / SatEff1
where SatEff1 is the saturation efficiency at frequency offset 1, and
SatEff2 is the saturation efficiency at frequency offset 2.
- For dual R.F. saturation powers, the first column (x-axis) contains the pH
values and the second column (y-axis) contains the ratio of saturation efficiency at
the two R.F. saturation powers (RPM):
RPM = SatEff2 / SatEff1
where SatEff1 is the saturation efficiency at R.F. power 1, and
SatEff2 is the saturation efficiency at R.F. power 2.
For these calibration curves, you need to ensure that the y-values (ratios)
increase monotonically with increasing pH. If the ratio increases, and then
decreases again, it is not possible to uniquely identify the pH from a
particular ratio.
When set up, press  to estimate the pH.
When complete, a new image is created showing the pH map.
The image name will be taken from the first input image, with a suffix "_pH".


 .
Select two input images of the CEST saturation efficiency at two different
frequency offsets.
 .
Select two input images of the CEST saturation efficiency at two
R.F. saturation powers.
 to estimate the pH.
When complete, a new image is created showing the pH map.
The image name will be taken from the first input image, with a suffix "_pH".