Lorentzian line fitting to the Z-spectrum
This module fits Lorentzian lines to the Z-spectrum in order to aid
quantification. Lorentzian fitting to CEST Z-spectra allows the derivation of
information from several different exchange effects that would otherwise be
convolved into a single asymmetry measurement. To perform Lorentzian fitting,
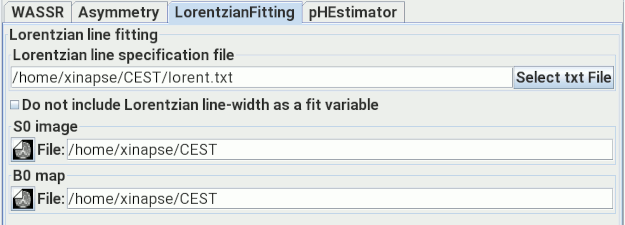
select the Lorentzian Fitting tab:

Set up the input section, then set:
- The Lorentzian line specification file. This is a text file that
you create using your favourite text editor, which determines the
Lorentzians to fit. The text file consists of 3 columns of numbers. Each
Lorentzian to be fitted occupies one line of the text file.
- The first column is the frequency offset (relative to water, in ppm)
of the Lorentzian central frequency. The central frequency is fixed and
is not a fit variable.
- The second column is the initial guess for the relative
amplitude, and must be between 0 and 1. The relative amplitude is a fit
variable.
-
The third column initial guess for the Lorenzian line-width
(full-width at half-maximum [FWHM]). The FWHM is a fit
variable, unless
 .
is selected. If selected, the FWHM is fixed to the value set in this
third column.
Note: in addition to the Lorentzians specified in the Lorentzian
line specification file, two other Lorentzians will automatically be
fitted:
- The first models direct water saturation. This has a fixed offset
frequency of zero.
- The second models MT effect. This has a fixed offset of -1 ppm, and
the FWHM is limited between 10 and 100 ppm.
Thus, you do not need to include the direct water saturation and MT
effects in the Lorentzian specification file.
Below is an example of a Lorentzian specification file which fits two
Lorentzians. The first is at 4.2 ppm, and with initial guesses for the
relative amplitude of 0.1, and FWHM of 0.25 ppm. The second is at 5.5
ppm, and with initial guesses for the relative amplitude of 0.05, and
FWHM of 0.2 ppm.
        4.2 0.1 0.25
        5.5 0.05 0.20
-
S0 image. The Z-spectrum is normalised by dividing by the
the image intensity with no saturation
pulses applied. Supply an image acquired using the same pulse sequences
as for Z-spectrum but without saturation pulses here:

This image must have the same dimensions as the Z-spectrum
images, and with a number of slices matching that set in the
input images section.
-
B0 map. This is a map of B0 inhomogeneity produced from the
WASSR analysis to correct for field deviations.

This image must have the same dimensions as the Z-spectrum
images, and with a number of slices matching that set in the
input images section.
When set up, press  to fit the Lorentzians pixel-by-pixel.
When complete, a new image is created for each of the Lorentzians in the
specification file, showing the integrated area under the Lorentzian.
The image name will be taken from the input image (or first input image, in the
case of multiple input images), with a suffix related to the Lorentzian
frequency offset (e.g. "_4.2").
N.B. fitting will take some time, particularly if Lorentzian
line-widths are included as fit variables.


 .
is selected. If selected, the FWHM is fixed to the value set in this
third column.


 to fit the Lorentzians pixel-by-pixel.
When complete, a new image is created for each of the Lorentzians in the
specification file, showing the integrated area under the Lorentzian.
The image name will be taken from the input image (or first input image, in the
case of multiple input images), with a suffix related to the Lorentzian
frequency offset (e.g. "_4.2").