Assessing the Z-spectrum Asymmetry
This module analyses the asymmetry of the Z-spectrum with repect to the
water frequency. The asymmetry can be assessed at a particular frequency
offset, or within a range of frequency offsets. To perform asymmetry analysis,
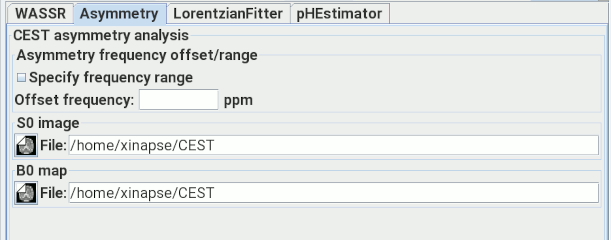
select the Asymmetry tab:

Set up the input section, then set:
- The frequency offset, in ppm relative to water, at which to assess the asymmetry. This can be
either:
- A single frequency offset:
 .
.
- A range of offset frequencies. Select the
 check box, and then enter the range of
frequencies:
 . The asymmetry is evaluated by averaging
over the frequency range set, which can help to improve robustness to
measurement noise.
-
S0 image. The asymmetry value is normalised by dividing the asymmetry
of the Z-spectrum by the image intensity with no saturation
pulses applied. Supply an image acquired using the same pulse sequences
as for Z-spectrum but without saturation pulses here:

This image must have the same dimensions as the Z-spectrum
images, and with a number of slices matching that set in the
input images section.
-
B0 map. This is a map of B0 inhomogeneity produced from the
WASSR analysis to correct for field deviations.

This image must have the same dimensions as the Z-spectrum
images, and with a number of slices matching that set in the
input images section.
When set up, press  to assess the asymmetry.
When complete, a new image is created which shows a map of the normalised asymmetry.
The image name will be taken from the input image (or first input image, in the
case of multiple input images), with a suffix related to the asymmetry
frequency offset (e.g. "_4.2" or "_4.0-4.4" in the examples above).


 .
.
 check box, and then enter the range of
frequencies:
 . The asymmetry is evaluated by averaging
over the frequency range set, which can help to improve robustness to
measurement noise.


 to assess the asymmetry.
When complete, a new image is created which shows a map of the normalised asymmetry.
The image name will be taken from the input image (or first input image, in the
case of multiple input images), with a suffix related to the asymmetry
frequency offset (e.g. "_4.2" or "_4.0-4.4" in the examples above).