Dynamic Contrast-Enhanced MRI (DCE-MRI) Analysis
Having set up your input and output images as described in the Introduction, you can now set up the
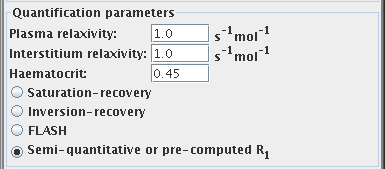
quantification parameters for DCE-MRI. In the DCE-MRI Analysis tool, you will see:

Quantification parameters
You should set the following parameters to obtain quantitative values
from the DCE-MRI analysis:
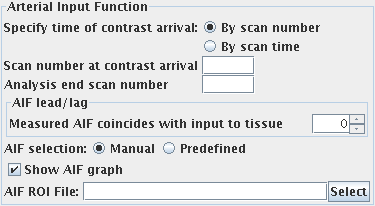
Arterial Input Function (AIF)

To obtain an arterial input function (the concentration of
contrast agent in an artery that feeds the tissue of interest), you must set
the following:
- The time at which contrast agent first appears in the feeding
artery. If you cannot see a feeding artery and are measuring the AIF in a
draining vein (or by some other means) then this should be the time at
which the image first changes in intensity as the contrast arrives in the
tissue. By selecting from
 , you can
specify this either as:
- The time at which contrast first appears (the first
image is acquired at t=0).
- The scan number at which contrast first appears (the first
scan is numbered 1).
Enter one of these. You can graphically confirm the arrival time using the
Roaming Response dialog.
- You may optionally enter the time at which the series of images is truncated
for the purposes of analysis. Images after this time will not be used as
part of dataset for the analysis. Analysis will proceed as if the data
after this time point has not been acquired.
By selecting from
 , you can
specify this either as:
- The time at which to truncate the data set, or
- The scan number at which to truncate the data set.
Enter one of these, or leave the field blank to use the whole dataset.
you can graphically confirm the time of truncation using the
Roaming Response dialog.
- Any lead or lag between the measured arterial input function and the
actual arterial feed directly into the tissue. This is specified as a
number of frames (time points) of lead or lag. If the measured input function is
upstream (proximal) compared to the artery that feeds directly into the tissue,
then this can be compensated by setting a positive number of frames for
the AIF lead/lag. If the measured input function is actually a venous drain,
then this can be compensated by providing a negative number of frames for
the AIF lead/lag. Change the AIF lead/lag using the AIF lead/lag spinner.

The text to the left explains the meaning of the lead/lag.
- Choose how you want to obtain the AIF. You can:
- Manually draw round a feeding artery to produce a region of interest (ROI). In this case you can
produce an ROI file that contains just a single ROI drawn
on one slice. This same ROI will be used for all time points to
obtain the AIF. Alternatively, you can define an ROI at one time point,
copy and paste it to the same slice location for all time
points, and manually adjust the position to account for patient movement
during the scan. If you do this, the tool will expect to find an ROI at
every time point, and will given an error if it does not.
Select the ROI file used for the AIF by pressing the
 button, or type the name into
the text field:

If you have specified the pulse sequence to be
saturation-recovery, inversion-recovery or FLASH, then you must
also supply an ROI file that contains an ROI drawn on the feeding artery
on the M0 image. Space will be provided in
the tool for you to enter the name of this ROI file.
- Use a predefined AIF. You can read the values of the AIF from
a file that contains a list of concentration of contrast
agent values. The file must contain two columns of numbers:
- The first column is ignored, but typically will have the time point
at which the [Gd] is measured. You can put in all zeros into this columns
if you want.
- The second column contains the concentration values (moles/L) averaged
over the whole blood.
A space character should separate the two columns.
The DCE-MRI tool will output such a file for every analysis it
performs, which will give you an example of what is needed. For
semi-quantitative analysis you just need values that are
proportional to the concentration of contrast agent in
the artery.
Select the file used for the predefined AIF by pressing the
 button, or type the name into
the text field:

- Check the "Show AIF graph" checkbox if you would like a window
to pop up showing you the AIF that is being used in the DCE-MRI analysis.
Analysis Type

First choose the model for the tissue response that you want to use:
- Tofts model. Here, the rate of flux of contrast agent from the
plasma to the extra-vascular extra-cellular space (EES) is assumed to be
proportional to the concentration difference between the plasma
and the EES. Within the tissue of interest, the blood plasma is
assumed to make a negligible contribution to the overall signal
intensity.
- Tofts model with vp term. This is a modified Tofts model that
includes a contribution to the signal intensity in the tissue of
interest from the blood plasma. An extra term (vp - the
blood plasma volume fraction of the whole tissue) is estimated.
Now choose whether you want to perform pixel-by-pixel analysis,
or region of interest (ROI) analysis. You can either:
- Estimate the DCE-MRI parameters for every image pixel,
producing output images of these parameters, or
- Estimate the DCE-MRI parameters for a whole ROI,
producing single values of these parameters. If you choose this
option, you will choose an ROI file which can contain either:
- A single ROI drawn on one slice. This same ROI will be used
for all time points.
- An ROI at every time point. Each ROI should be the same shape
and size (which can be achieved by copying and pasting an ROI to
all the desired slices) for all time points, but you can manually
adjust the position to account for movement of the tissue of
interest.
If you choose this option, you will need to supply the name of the
ROI file, and also the base name of the AIF output file. This
output file will be written with the AIF used in the analysis.
If you have specified the pulse sequence to be either
saturation-recovery, inversion-recovery or FLASH, then you must
also supply an ROI file that contains an ROI of the same shape and size as
the region to be analysed, positioned on the M0 image.
Space will be provided in the tool for you to enter the name of this ROI file.
DCE-MRI Output Parametric Images
The DCE-MRI analysis produces either three or four output images,
depending on the Analysis Type chosen. The output images will have the
same base name, but with the output parameter name appended. These are:
- Ktrans. The volume transfer constant, with units of ml / ml / minute.
- ve. The extra-vascular extra-cellular space volume fraction
(as a fraction of the whole tissue volume). Values in this output image
will range between 0 and 1.
- vp. The blood plasma volume fraction (as a fraction of the
whole tissue volume), produced if you chose the analysis type
"Tofts model with vp term". Values in this output image will range
between 0 and 1.
- RSq. A measure of the goodness of fit. This is the sum of the
squares of the residuals between the fitted curve and the
time-series data.
These output images are in floating-point format, and can be
viewed using Jim. The output images will be of the same
image type as the first input image.


 icon, or
by typing in the directory and file names.


 , you can
specify this either as:
 , you can
specify this either as:

 button, or type the name into
the text field:

 button, or type the name into
the text field:

