Roam ... from the View menu of
the CEST Analysis tool:
 . Both
the ROI Toolkit, and the Roaming Z-spectrum dialog will pop up.
Once you have set up the CEST Analysis tool to perform an analysis, you can visualise the Z-spectrum interactively. You can:
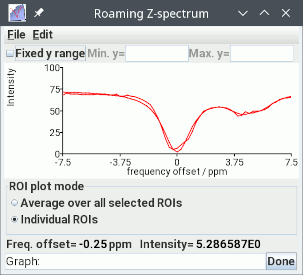
The Z-spectrum and associated analysis are viewed in a pop-up graph.
First, set up the CEST Analysis tool tool exactly as you would to perform a whole-image analysis, as in sections 3-5. Next, load an image into Jim's display. The image you load can be any of the input images (or the input image if you have just a single input image).
To view the Z-spectrum, select Roam ... from the View menu of
the CEST Analysis tool:
 . Both
the ROI Toolkit, and the Roaming Z-spectrum dialog will pop up.

Then, either:
The Z-spectrum will now be displayed in the Roaming Z-spectrum dialog. Along with the Z-spectrum, the dialog may also shows the result of the selected CEST analsysis. These are:

Z-spectrum and fitted Lorentzians
The y- data range of the graph is automatically scaled to match the data. If you want to fix the range of data on the y-axis, select the "Fix range" check box, and type in a range that you want to be displayed.
You can write the data and the graph to a disk file by selecting
Write from the File menu: 
The graph data is written in a tab-separated table with
two columns: the first is the frequency offset
and the second is the pixel intensity. See also
the File Formats section.
Note: If you change any settings in the Roaming Z-spectrum Dialog, you may need to de-select and re-select the ROI before the graph is updated.